Drive Insights
Unleash the Power of Data Visualization
Unlock the true potential of data analysis with DRVR’s Drive Insights. Our robust Business Intelligence toolkit is designed to seamlessly transform your data into actionable insights.
With Drive Insights, you will gain a comprehensive view of your business, identify trends, and make data-driven decisions with confidence.
Core Problems
when it comes to data management and analysis.

Data Overload
Fleet operators often deal with an overwhelming volume of data from multiple sources, such as vehicles, GPS systems, maintenance logs, and more. Managing this can be challenging, leading to information overload.

Data Quality and Accuracy

Lack of Actionable Insights
Extracting meaningful insights from raw data presents difficulties, obstructing efforts to enhance safety, reduce costs, and optimize operations.

Data Overload

Data Quality and Accuracy

Lack of Actionable Insights
Our Solutions
Drive Insights, a comprehensive Business Intelligence toolkit consisting of three elements:
Data Source
Unlock the power of your existing data by seamlessly extracting it from various service providers. We securely gather data from your systems, process it, and deliver rich and meaningful visualizations.
Data Aggregation and Analysis
Visualization Layer
Key Features

Seamlessly integrates with your existing GPS systems, eliminating the need for additional devices

No extra hardware installation required, ensuring a hassle-free setup

Fully customizable dashboard that aligns with your unique requirements

Affordable monthly subscription
Explore of Drive Insights Dashboard
Drive Insights – Fuel Dashboard
Unlock the full potential of Business Intelligence analytics in the transportation
and mobility sector with our Fuel Dashboard.
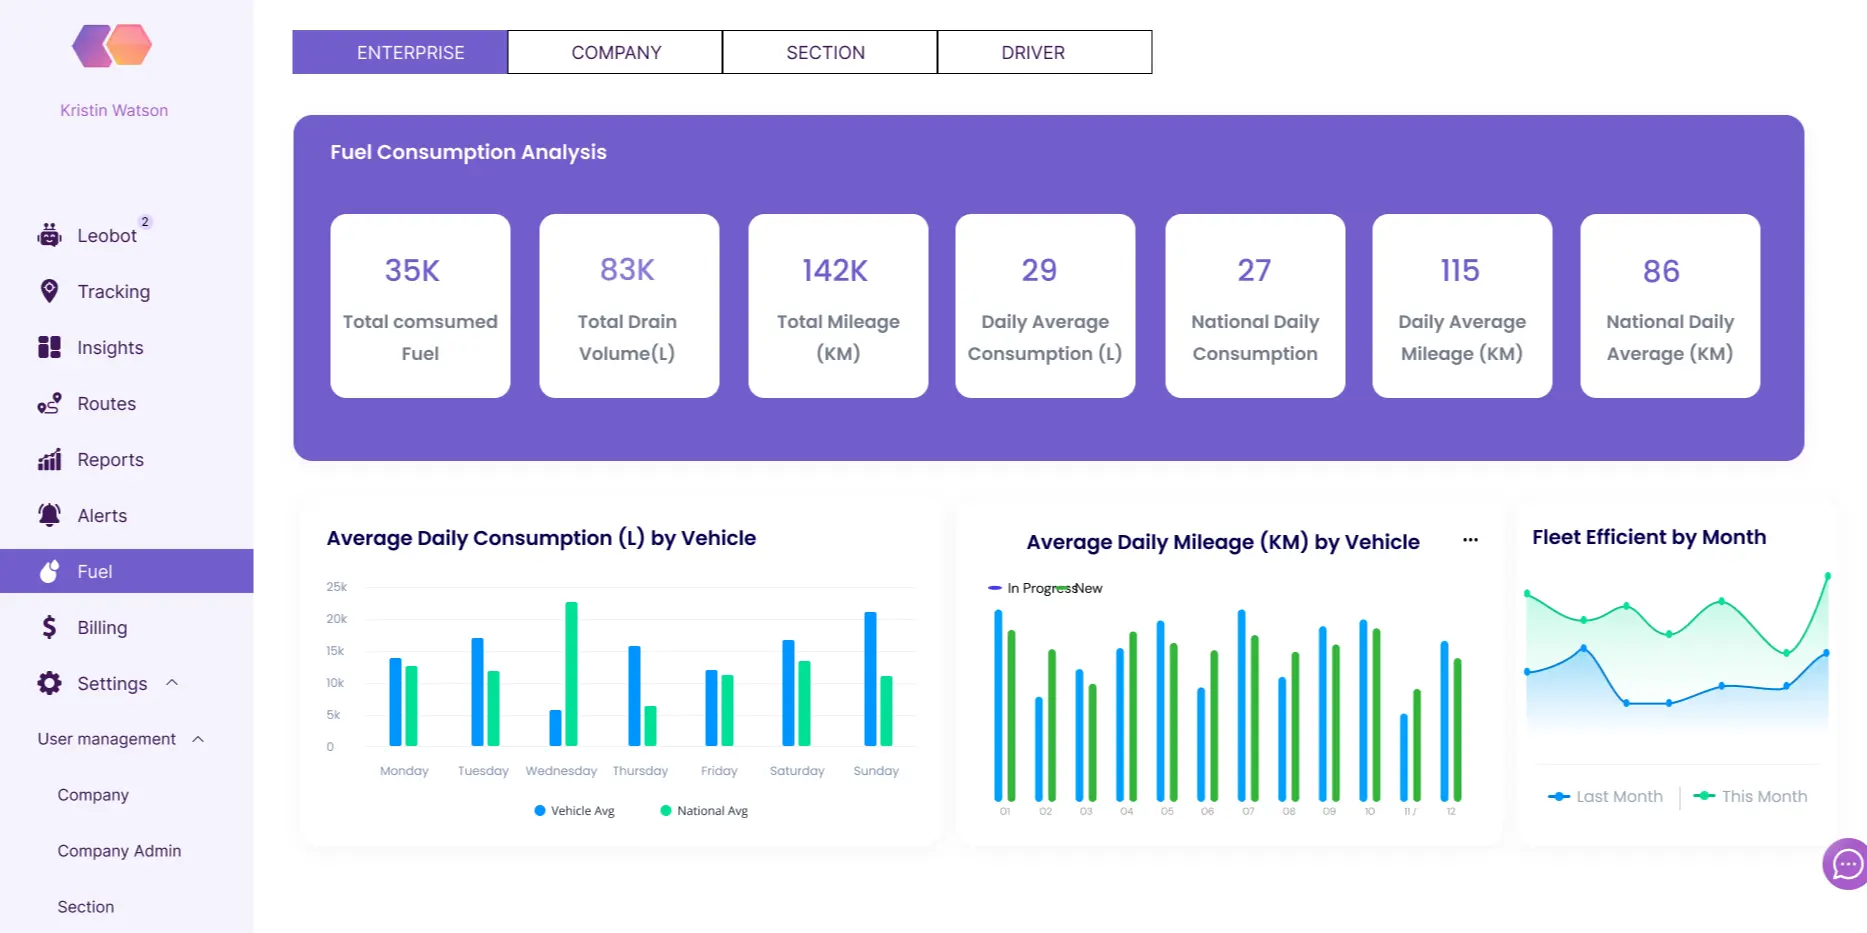
Fuel Consumption
Monitor fuel usage across your fleet
Fuel Efficiency
Optimize fuel efficiency to reduce costs
Fuel Theft
Fleet Idling
Minimize fleet idling to improve operational efficiency
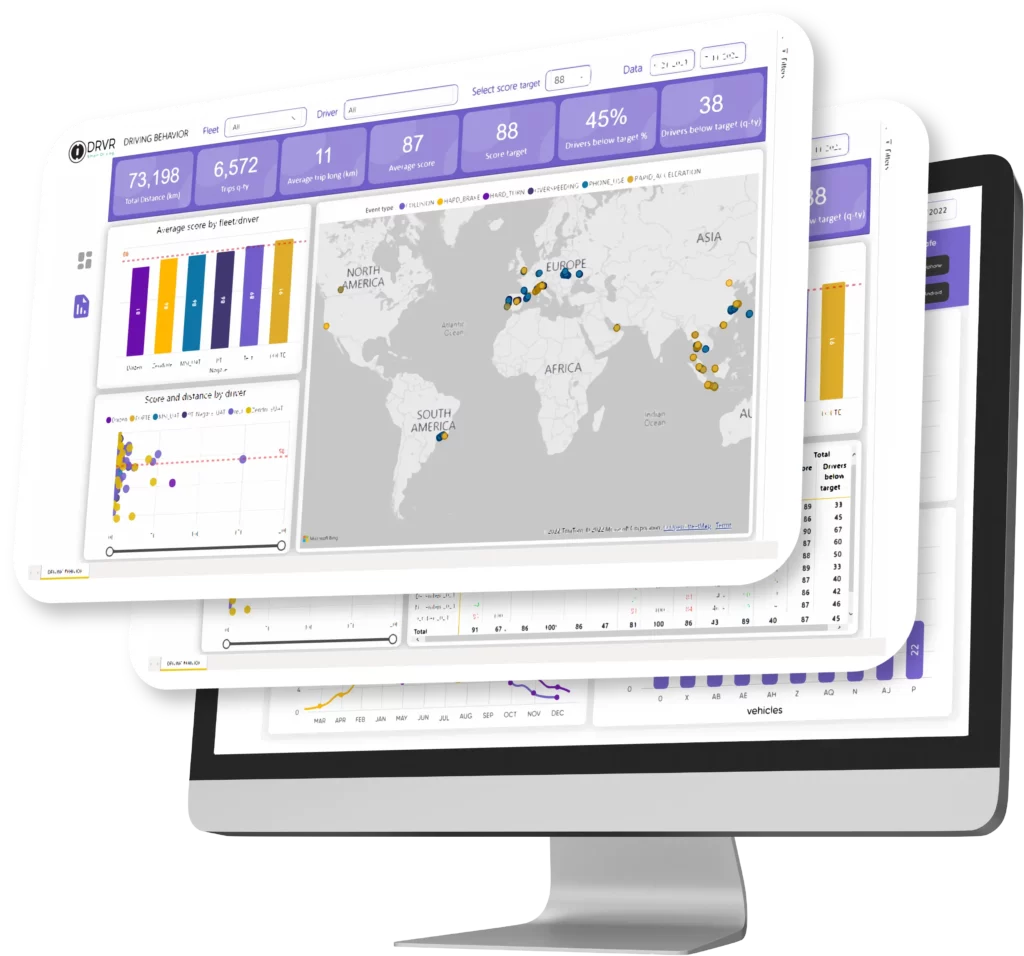
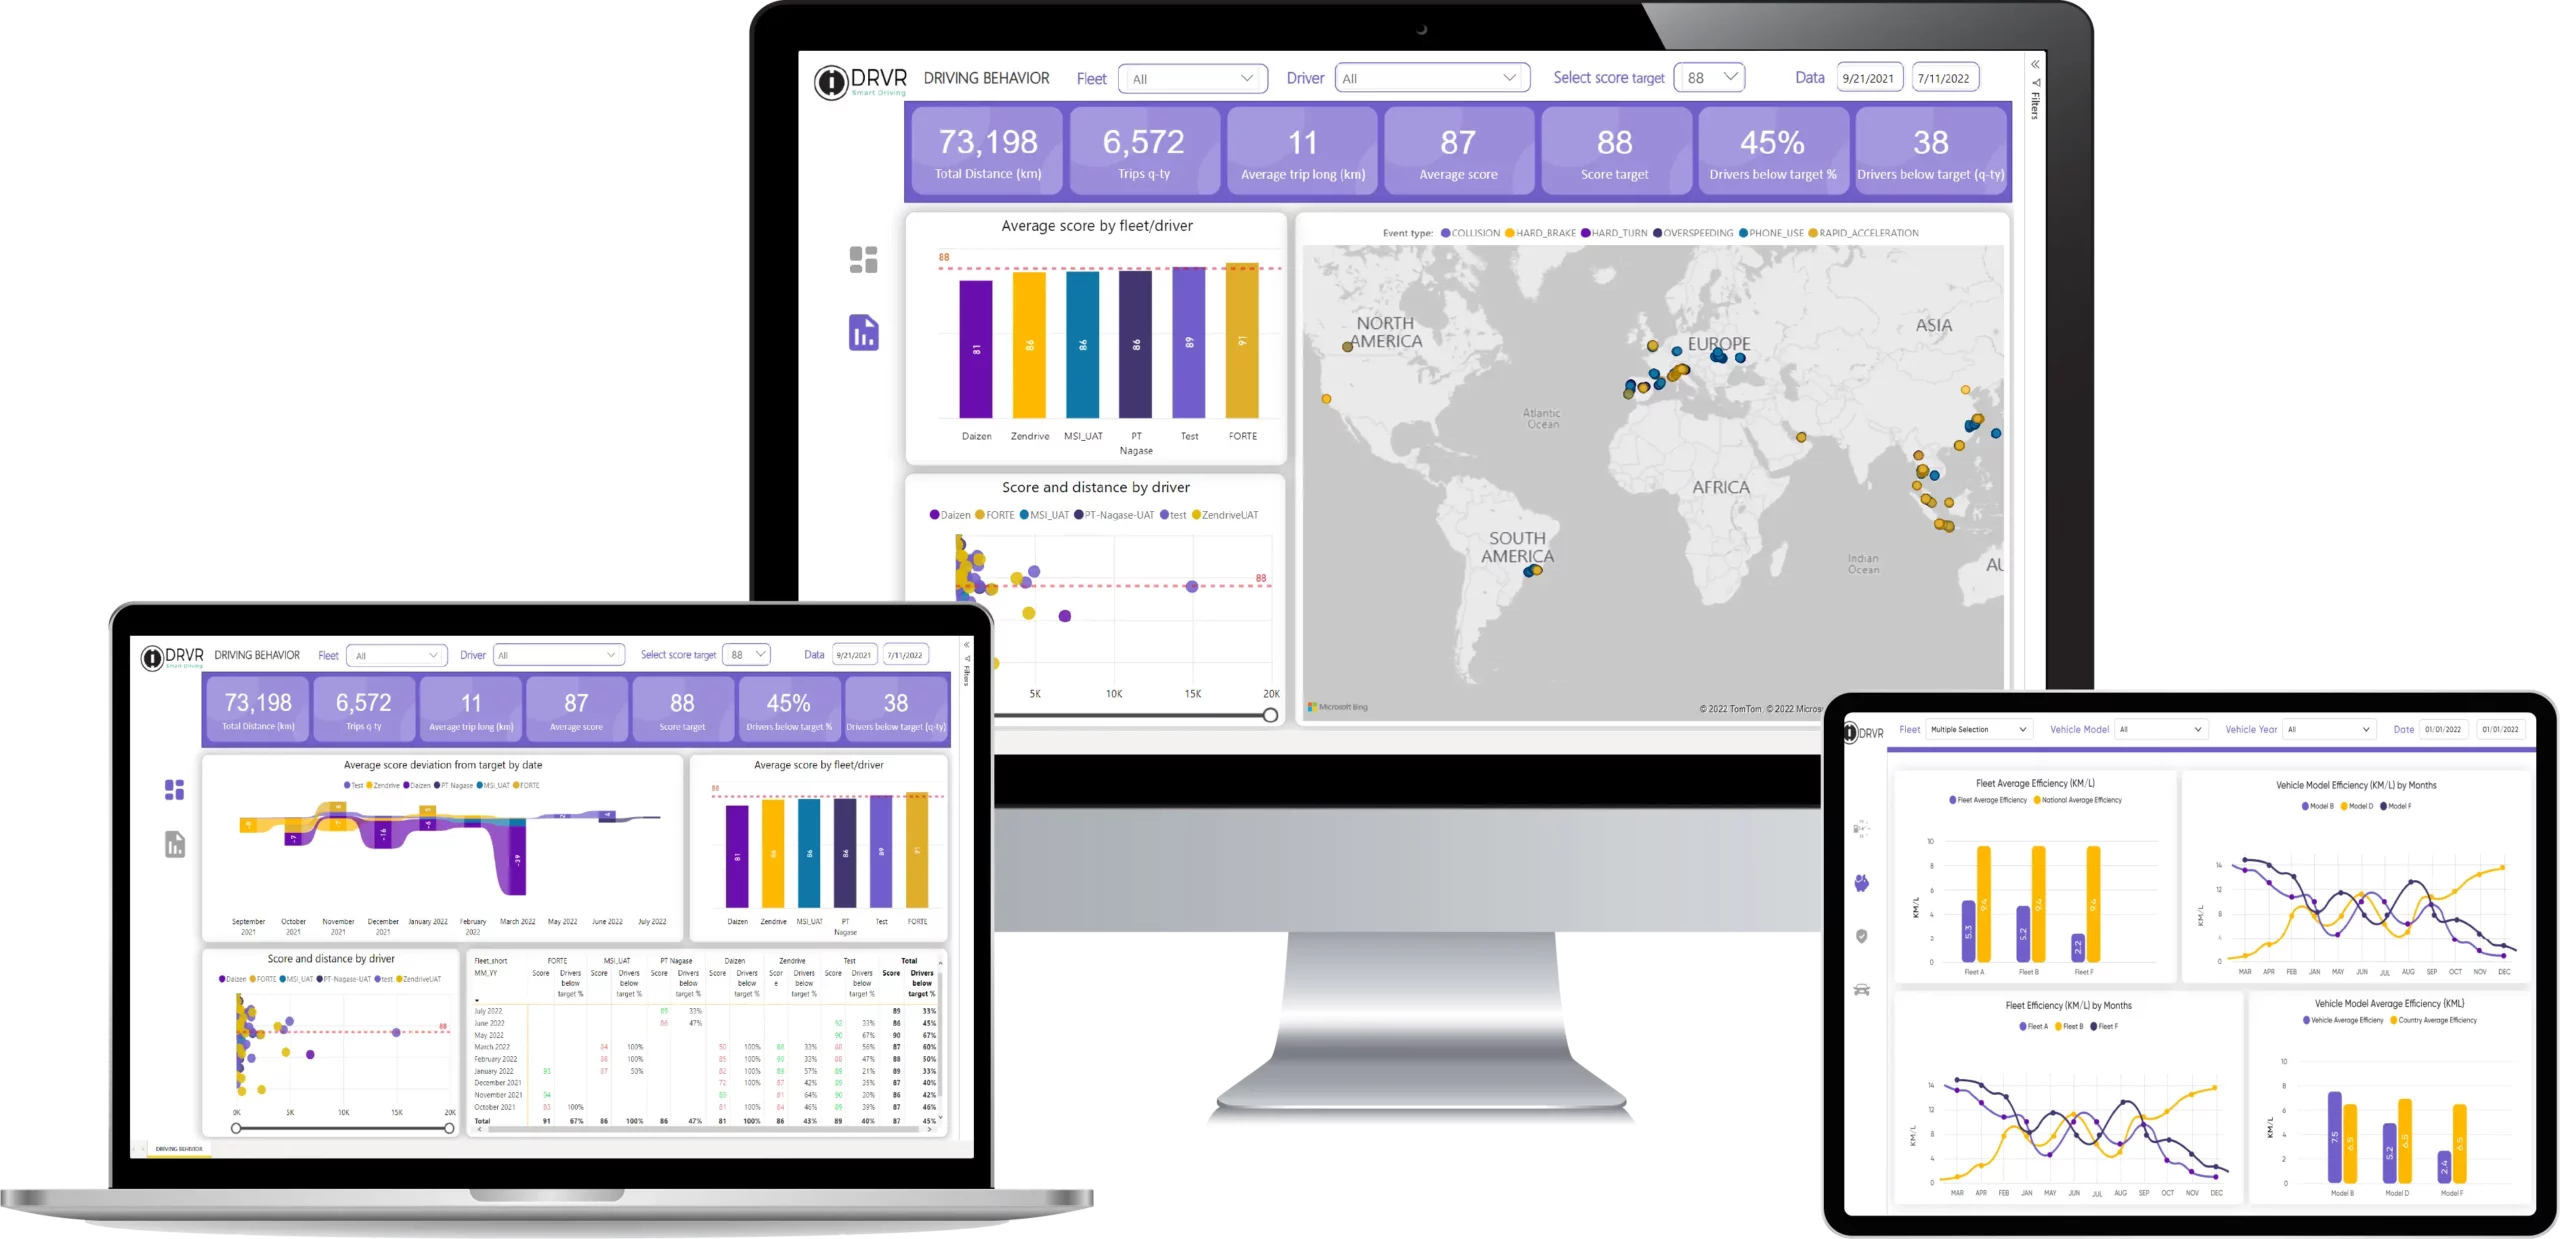
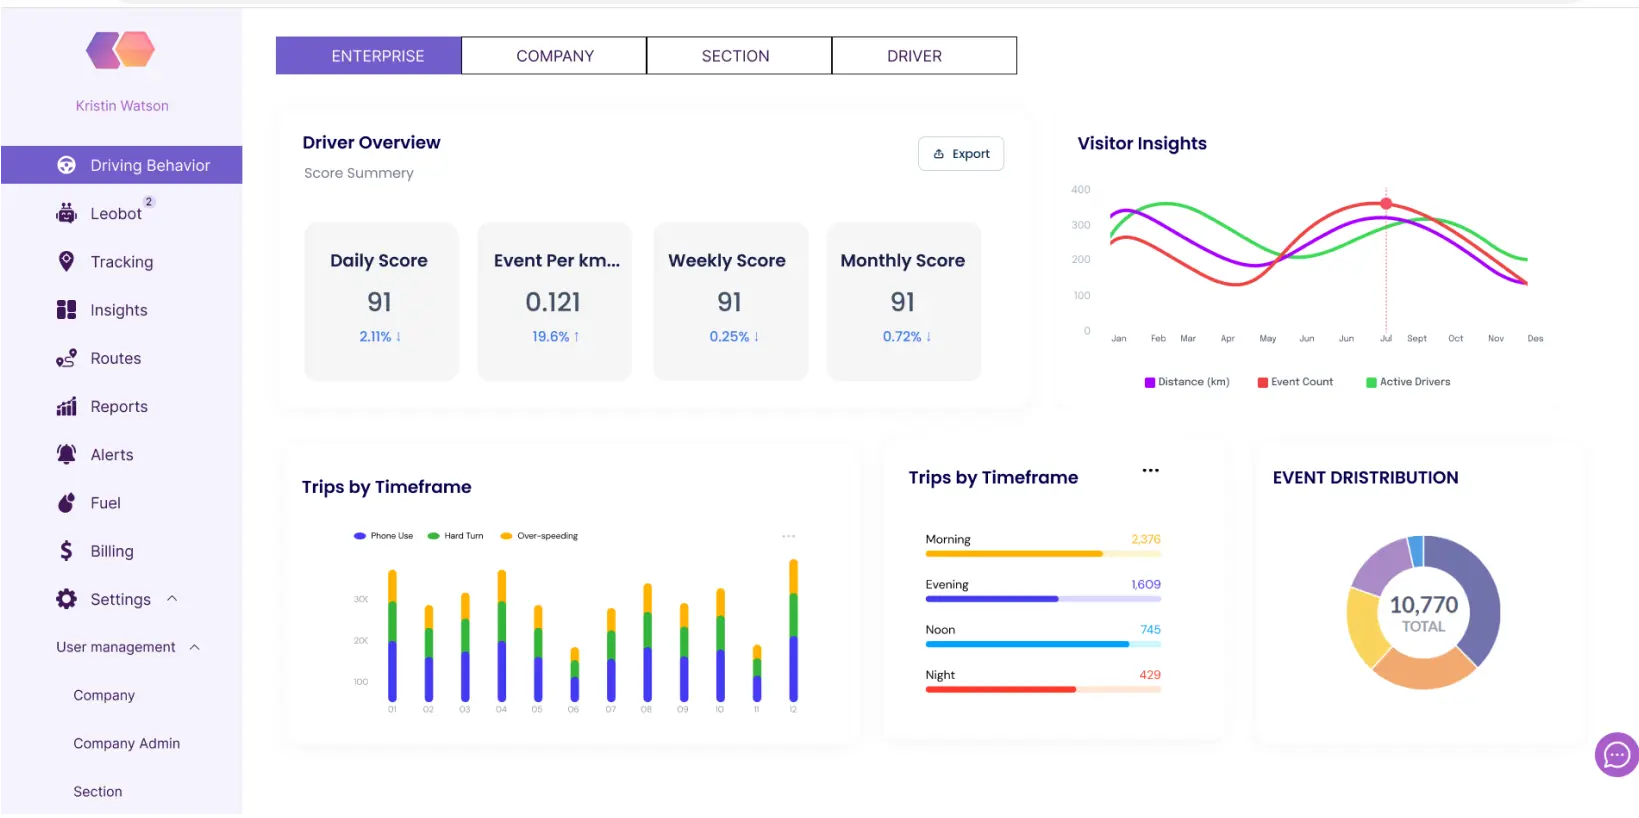
Drive Insights – Driving Behavior Dashboard
Ultimate tools to gain insights into driving behavior, enabling data-driven decisions that enhance safety and efficiency.
Improved Safety
Lower Maintenance Costs
Driver Accountability
Regulatory Compliance
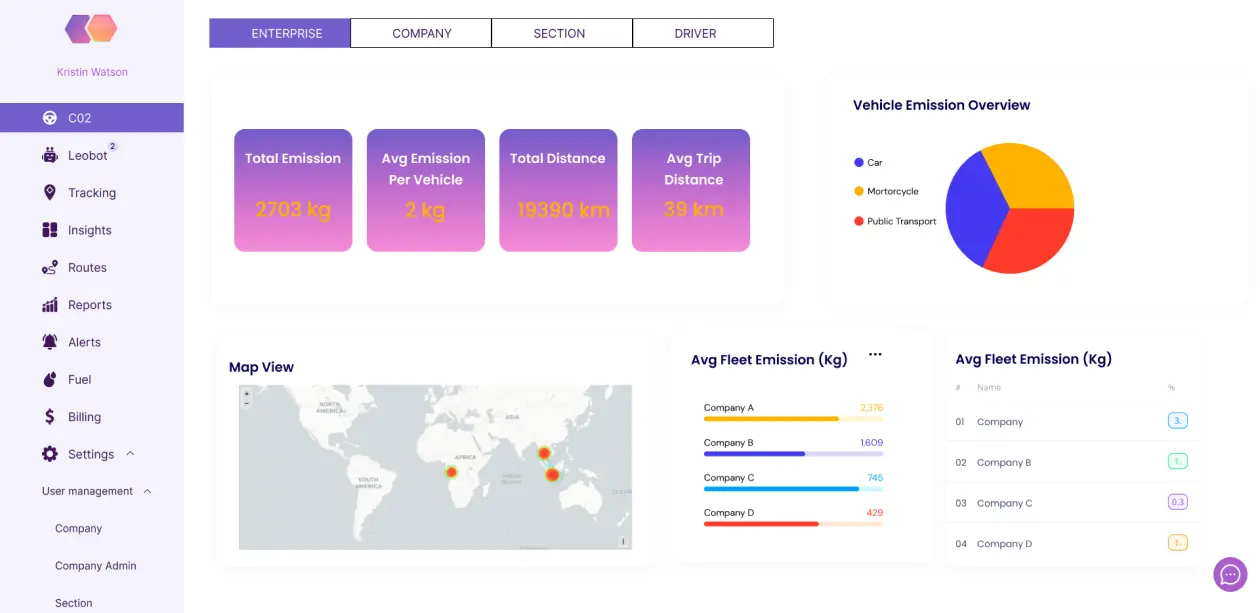
Drive Insights – CO2 Emission Dashboard
Offers a holistic perspective on your emission data, empowering you to make environmentally responsible decisions.
